
Most San Diego Airbnb Listings Look Fine Until You Compare Them
By Jeremy Ashburn
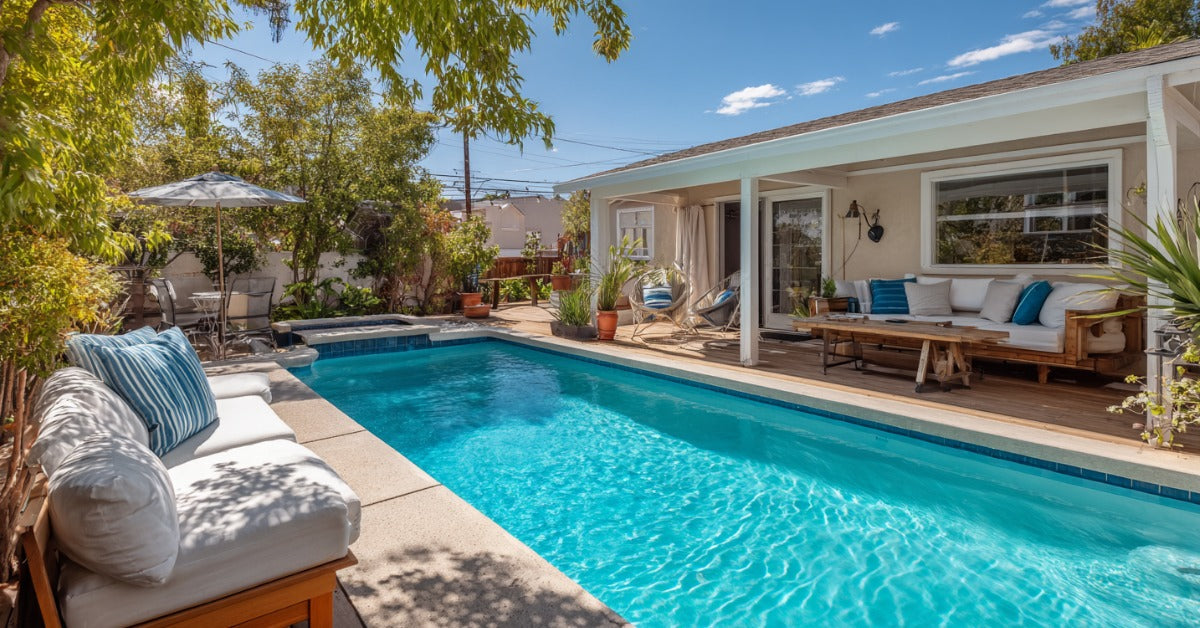
Your San Diego Airbnb listing probably looks fine to you. The photos show a clean space with furniture, the amenities list checks all the boxes, and the description explains what guests get. You've had decent reviews over the years, and nothing seems obviously wrong. But here's the brutal truth when guests compare your listing to others in your neighborhood, yours fades into the background. It doesn't stand out. It doesn't excite. It doesn't make guests think "I have to book this one." Most San Diego hosts don't realize their listing is mediocre until they actually sit down and compare it side by side with competitors who are staying fully booked. Once you see the gap, you can't unsee it, and you'll finally understand why your occupancy has been dropping.
Is your listing actually competitive, or just "fine"? Contact us for a free competitive analysis showing exactly how your property stacks up, or call 619-738-6199.
The "Fine" Property Trap
Here's how the cycle works. You set up your Airbnb in 2020 through 2022 when demand was insane. You took some decent photos with your phone, wrote a straightforward description, listed your amenities, and bookings flooded in. Guests left positive reviews. Everything seemed great.
Fast forward to 2025 and 2026. Bookings have slowed. You're getting fewer inquiries. Your occupancy dropped from 70% to 50% or lower. You don't understand why because your property hasn't changed. The reviews are still good. Nothing broke. It looks the same as it always has.
The problem isn't that your property got worse. The problem is that the competition got dramatically better while you stayed the same.
Between 2020 and 2025, thousands of new San Diego listings launched. Many of these hosts invested heavily in professional design, photography, and amenities because they entered a more competitive market. They studied what top performers were doing and replicated it. Your property that was "fine" in 2021 is now below average in 2026.
Let's look at what guests see when they compare.
- Your "Fine" Listing
- Cover Photo: Room with furniture, natural light
- Photo Count: 12 to 15 photos
- Bedroom Photos: Basic bed with standard bedding
- Living Space: Functional couch and TV
- Kitchen: Appliances and clean counters
- Outdoor Space: Patio furniture visible
- Cover Photo: Professionally styled space, perfect lighting, eye catching
- Photo Count: 35 to 45 photos showing every angle
- Bedroom Photos: Styled bed, accent wall, layered lighting, decorative pillows
- Living Space: Curated design, conversation areas, plants, art
- Kitchen: Styled with accessories, modern fixtures, breakfast bar setup
- Outdoor Space: Styled with string lights, plants, dining setup, cozy seating
- Cover Photo: "Wow, that looks amazing" vs "That looks... fine"
- Photo Count: More confidence in what they're getting
- Bedroom Photos: One feels like a hotel, one feels basic
- Living Space: One says "hang out here," one says "just a couch"
- Kitchen: One invites cooking, one just shows appliances
- Outdoor Space: One creates experience, one shows space
Your listing shows your property. Their listing sells an experience. Guests scroll through your photos thinking "This would work." They scroll through theirs thinking "I want to stay here."
The Photography Gap Nobody Talks About
Most San Diego hosts dramatically underestimate how much photography matters. You think "My photos show the space clearly, that's good enough." Meanwhile, guests are making booking decisions in 3 to 5 seconds based on visual appeal.
Here's what happens in actual guest browsing behavior.
Your iPhone Photos Guest sees cover photo and thinks "Okay, that's a bedroom." They scroll through 3 or 4 more photos and think "Yeah, it looks clean enough." They don't feel excited, so they keep browsing. They never come back to your listing.
Professional Photography Guest sees cover photo and thinks "Oh wow, that looks incredible." They immediately click to see more photos. They scroll through entire gallery thinking "Every room looks this good?" They add to favorites and are likely to book.
The visual quality gap creates a psychological divide. Professional photos signal quality, attention to detail, and a host who cares about guest experience. Amateur photos signal "budget option" even when your property is actually nice.
Let's compare the reality.
- DIY Phone Photos
- Lighting: Natural light, shadows, uneven
- Angles: Straight on, cramped feeling
- Staging: Shows space as is
- Color Correction: Phone's auto settings
- Consistency: Varies by room, time of day
- Guest Perception: "Budget rental"
- Lighting: Perfectly lit, balanced, bright
- Angles: Wide angle, spacious feeling
- Staging: Styled with props, accessories
- Color Correction: Professionally edited
- Consistency: Cohesive visual story
- Guest Perception: "Premium experience"
- Lighting: 3x more appealing
- Angles: Property looks 20% to 30% larger
- Staging: Creates emotional connection
- Color Correction: Warm and inviting vs cold and flat
- Consistency: Professional vs amateur signal
- Guest Perception: 40% to 60% higher booking rate
The Revenue Math
- Monthly Bookings
- iPhone photos (current): 8 bookings
- Professional photos: 13 bookings
- Difference: Plus 5 bookings
- iPhone photos (current): 48%
- Professional photos: 72%
- Difference: Plus 24 points
- iPhone photos (current): $4,400
- Professional photos: $7,150
- Difference: Plus $2,750 per month, up 63%
Professional photography costs $400 to $800 one time. That investment pays for itself in the first month and continues generating returns for 12 to 18 months until you need updated photos.
The Design Mediocrity That Kills Bookings
Your furniture is functional. Your color scheme is neutral. Everything matches well enough. The space is clean and organized. It's fine.
But "fine" doesn't win bookings anymore. Guests are comparing your beige, safe, generic space to properties that look like they belong in design magazines. Even if your bones are better, their presentation wins.
Here's what guests notice when comparing design.
Your "Fine" Space Builder grade everything like light fixtures, hardware, and finishes. Furniture from standard retailers with nothing special. Neutral colors with no accent walls or personality. Minimal or no artwork on walls. Basic bedding in solid colors. Standard kitchen accessories. No distinctive style or theme.
Competitor's Designed Space Updated fixtures, modern hardware, upgraded finishes. Curated furniture pieces that photograph well. Intentional color palette with accent walls and pops of color. Gallery wall with local art and statement pieces. Layered bedding with throw pillows and texture. Styled kitchen with plants and decorative elements. Clear design identity like coastal modern, industrial chic, or boho retreat.
The competitor's space tells a story. Yours just shows furniture in rooms.
Let's see the design gap in specific areas.
- Generic Approach
- Living Room: Standard couch, coffee table, TV
- Primary Bedroom: Queen bed, nightstands, lamp
- Kitchen: Clean appliances, clear counters
- Bathroom: Clean towels, basic toiletries
- Outdoor Space: Basic patio furniture
- Living Room: Sectional with accent chairs, styled coffee table, gallery wall, plants, throw blankets
- Primary Bedroom: King bed with upholstered headboard, layered bedding, accent wall, reading nook
- Kitchen: Styled with coffee bar, plants, cookbook display, modern bar stools
- Bathroom: Spa like with plants, candles, upgraded fixtures, plush towels, welcome amenities
- Outdoor Space: String lights, outdoor rug, dining area, lounge seating, planters
- Living Room: Instagram worthy vs forgettable
- Primary Bedroom: Luxury feel vs basic
- Kitchen: Invitation to cook vs just functional
- Bathroom: Experience vs utility
- Outdoor Space: Extension of living space vs afterthought
The Investment vs Return
- Investment
- Basic refresh (paint, decor, accessories): $3,000 to $5,000
- Moderate upgrade (furniture, lighting, staging): $8,000 to $15,000
- Complete transformation (everything): $20,000 to $35,000
- Basic refresh (paint, decor, accessories): Plus $15 to $25 per night
- Moderate upgrade (furniture, lighting, staging): Plus $35 to $50 per night
- Complete transformation (everything): Plus $60 to $100 per night
- Basic refresh (paint, decor, accessories): Plus 5% to 8%
- Moderate upgrade (furniture, lighting, staging): Plus 12% to 18%
- Complete transformation (everything): Plus 20% to 30%
- Basic refresh (paint, decor, accessories): Plus $8,000 to $15,000
- Moderate upgrade (furniture, lighting, staging): Plus $20,000 to $35,000
- Complete transformation (everything): Plus $40,000 to $70,000
Even modest design investments generate 3 to 5 times returns in the first year through higher rates and better occupancy from improved booking conversion.
The Amenity Expectations You're Missing
Your listing probably includes the basics like WiFi, TV, kitchen, washer and dryer, and parking. You might even have some nice touches like coffee and basic toiletries. It's fine.
But guests aren't comparing your amenities to what was standard in 2020. They're comparing to what top performing 2026 properties offer, and the bar has risen dramatically.
Here's the current amenity hierarchy.
Minimum Requirements (not booking advantages, just won't get rejected) Fast WiFi at 100 Mbps or higher, ideally 200 Mbps or higher. Smart TV with Netflix, Hulu, and similar services but NOT cable. Full kitchen with all cookware and dishes. In unit washer and dryer. Central air conditioning. Quality mattresses, not cheap Amazon foam. Blackout curtains in bedrooms. Basic toiletries and paper products.
Competitive Differentiators (what gets you bookings) Dedicated workspace with monitor and ergonomic chair. Streaming services pre logged to save guest hassle. Premium coffee setup like espresso machine or quality drip. Beach equipment including chairs, umbrella, towels, and cooler. Bikes for neighborhood exploration. Smart home features like keyless entry and smart thermostat. Quality bedding at hotel grade, not budget. Welcome basket with local treats and recommendations. Games, books, and local activity guides. Outdoor entertainment like grill, dining area, and string lights.
Premium Experience Creators (what gets you top rates) Hot tub or spa. Fire pit or outdoor fireplace. Premium sound system. Gym equipment or yoga space. Multiple workspaces for remote work. Kids' amenities like pack and play, high chair, and toys. Pet friendly with pet amenities. Garage parking, not just street. Rooftop or water views. Game room or entertainment space.
Let's compare the competitive positioning.
- Your "Fine" Listing
- Work Setup: "WiFi available"
- Coffee: Drip coffee maker, basic coffee
- Beach Gear: "Beach nearby"
- Entertainment: Basic TV
- Outdoor: Small patio
- Work Setup: Dedicated office, 27 inch monitor, Herman Miller chair, ring light
- Coffee: Espresso machine, grinder, premium beans, variety of options
- Beach Gear: 4 chairs, 2 umbrellas, beach towels, cooler, beach toys
- Entertainment: Smart TV in every room, sound bar, streaming services, game console
- Outdoor: Styled dining for 6, lounge area, grill, string lights, fire pit
- Work Setup: Remote workers book competitor
- Coffee: Coffee lovers book competitor
- Beach Gear: Families book competitor
- Entertainment: Groups book competitor
- Outdoor: Everyone prefers competitor
The Revenue Impact of Amenities
- Cost
- Premium coffee setup: $400
- Beach gear package: $600
- Dedicated office setup: $1,500
- Hot tub installation: $8,000
- Premium coffee setup: Plus $5 per night
- Beach gear package: Plus $10 per night
- Dedicated office setup: Plus $20 per night
- Hot tub installation: Plus $60 per night
- Premium coffee setup: Minimal
- Beach gear package: Plus 3% occupancy
- Dedicated office setup: Plus 8% occupancy
- Hot tub installation: Plus 15% occupancy
- Premium coffee setup: Plus $75 per month
- Beach gear package: Plus $180 per month
- Dedicated office setup: Plus $400 per month
- Hot tub installation: Plus $1,800 per month
- Premium coffee setup: 5 to 6 months
- Beach gear package: 3 to 4 months
- Dedicated office setup: 3 to 4 months
- Hot tub installation: 4 to 5 months
Strategic amenity investments pay for themselves quickly through higher rates and better occupancy from improved guest appeal.
The Description That Says Nothing
Your listing description probably hits the standard points like number of bedrooms, location highlights, house rules, and nearby attractions. It's informative. It's accurate. It's completely forgettable.
Meanwhile, top performing listings craft descriptions that sell an experience, paint a picture, and make guests feel something before they ever arrive.
Your "Fine" Description "Comfortable 2 bedroom home near downtown San Diego. Sleeps 6. Full kitchen, WiFi, parking. Close to beaches, restaurants, and attractions. Check in after 3pm, check out by 11am. No smoking, no parties."
Competitor's Compelling Description "Wake up to California sunshine streaming through skylights in this designer North Park retreat. Your mornings start with artisan coffee from the espresso bar before you walk 3 minutes to the neighborhood's famous brunch spots. Spend afternoons exploring local craft breweries, then return to your private oasis with a sunset cocktail on the string lit patio. This isn't just a place to sleep, it's your home base for experiencing San Diego like a local."
Both describe the same basic facts. One makes you want to book. One just informs.
Here's the breakdown.
- Generic Approach
- Opening Hook: "2BR apartment in..."
- Features: Lists like "WiFi, parking, kitchen"
- Location: "Near beach and restaurants"
- Experience: Describes property
- Call to Action: House rules and policies
- Opening Hook: Sensory detail, emotion, experience
- Features: Integrates into story like "stay connected while..."
- Location: Specific distances, named favorites, insider tips
- Experience: Describes guest's potential experience
- Call to Action: Invitation to book, preview their stay
- Opening Hook: Sets tone immediately
- Features: Shows how features benefit guests
- Location: Builds excitement and credibility
- Experience: Creates emotional connection
- Call to Action: Motivates action
The Conversion Impact
- Views to Inquiry Rate
- Generic and informational: 4% to 5%
- Well written and engaging: 8% to 10%
- Generic and informational: 15% to 20%
- Well written and engaging: 30% to 40%
- Generic and informational: 0.6% to 1.0%
- Well written and engaging: 2.4% to 4.0%
- Generic and informational: Baseline
- Well written and engaging: 3 to 4 times more bookings
Your description is often a guest's first detailed impression of your property. Generic descriptions signal amateur operation. Compelling descriptions signal exceptional experience.
The Review Score Plateau
Your overall rating is probably 4.5 to 4.7 stars. Your recent reviews are mostly positive with occasional 4 star ratings mixed in. It's fine, better than many listings.
But "fine" review scores are crushing your visibility. Platform algorithms now treat 4.8 stars and above as the threshold for premium placement. Below 4.8, you're essentially invisible to most searchers.
Here's how guests compare review profiles.
- Your "Fine" Reviews
- Overall Score: 4.6 stars (looks good)
- Review Count: 47 reviews
- Recent Ratings: Mix of 4s and 5s
- Review Length: Short, generic praise
- Host Responses: Responds to some
- Photo Reviews: Few guest photos
- Overall Score: 4.9 stars (excellent)
- Review Count: 183 reviews
- Recent Ratings: Consistent 5s
- Review Length: Detailed, specific experiences
- Host Responses: Responds to every review within 24 hours
- Photo Reviews: Many guest photos showing experience
- Overall Score: You're buried in search
- Review Count: Social proof advantage
- Recent Ratings: Algorithm sees declining quality
- Review Length: Higher guest confidence
- Host Responses: Algorithm reward
- Photo Reviews: Visual social proof
The Visibility Impact
- Search Placement
- 4.9 to 5.0 stars: First page, top positions
- 4.8 to 4.89 stars: First page, middle
- 4.6 to 4.79 stars: Second page
- 4.3 to 4.59 stars: Third page or worse
- 4.9 to 5.0 stars: 850 to 1,200
- 4.8 to 4.89 stars: 450 to 650
- 4.6 to 4.79 stars: 180 to 280
- 4.3 to 4.59 stars: 45 to 90
- 4.9 to 5.0 stars: 12 to 15
- 4.8 to 4.89 stars: 9 to 11
- 4.6 to 4.79 stars: 6 to 8
- 4.3 to 4.59 stars: 3 to 5
- 4.9 to 5.0 stars: Baseline (best)
- 4.8 to 4.89 stars: Down 25% revenue
- 4.6 to 4.79 stars: Down 45% revenue
- 4.3 to 4.59 stars: Down 70% revenue
Your 4.6 score isn't "pretty good," it's actively preventing guests from ever seeing your listing. Even if your property is nicer than competitors, they get booked because they're visible and you're not.
The Little Details That Create Big Gaps
Beyond the obvious elements, it's often the small touches that separate "fine" from "exceptional" in guest perception.
Arrival Experience Your listing has standard lockbox with text containing the code. Top competitor has smart lock with personal welcome message, detailed arrival guide with photos, and welcome text checking in.
First Impression Your listing has clean space with lights on. Top competitor has curated playlist playing, temperature pre set, lights dimmed, welcome basket on counter, and handwritten note.
Bathroom Amenities Your listing has basic shampoo and conditioner with standard towels. Top competitor has premium products, plush towels, extras like face wipes and cotton swabs, plus matches for odor.
Kitchen Stocking Your listing has basic cooking essentials and salt with pepper. Top competitor has extensive spices, quality olive oil, coffee and tea selection, plus starter groceries like milk, eggs, and butter.
Information Provided Your listing has WiFi password on fridge and maybe a binder. Top competitor has beautiful custom guidebook, QR codes for digital guide, restaurant reservations contact, and local insider tips.
Departure Process Your listing has checkout instructions to strip beds and start dishwasher. Top competitor has simple checkout with no tasks, thank you message, and invitation to rebook with discount code.
These details individually seem minor. Cumulatively, they create an experience gap that shows up in reviews, repeat bookings, and referrals.
The Detail Investment Impact
- Investment
- Smart locks plus welcome automation: $250 to $400
- Premium amenities package: $150 to $250
- Custom guidebook plus local tips: $200 to $500
- Welcome basket plus starter supplies: $25 to $40 per booking
- Combined effect: Around $850 plus ongoing
- Smart locks plus welcome automation: Immediate positive impression
- Premium amenities package: Spa like feeling
- Custom guidebook plus local tips: Insider experience
- Welcome basket plus starter supplies: Thoughtful hosting
- Combined effect: "This was amazing!"
- Smart locks plus welcome automation: Plus 0.1 stars
- Premium amenities package: Plus 0.15 stars
- Custom guidebook plus local tips: Plus 0.2 stars
- Welcome basket plus starter supplies: Plus 0.15 stars
- Combined effect: Plus 0.4 to 0.6 stars
- Smart locks plus welcome automation: Plus 5% bookings
- Premium amenities package: Plus 8% bookings
- Custom guidebook plus local tips: Plus 12% bookings
- Welcome basket plus starter supplies: Plus 10% bookings
- Combined effect: Plus 35% to 50% revenue
The Competitive Reality Check
Here's how to actually see the gap between your listing and top performers.
Step 1. Search Like a Guest (30 minutes) Go to Airbnb in incognito mode. Search your neighborhood for 3 night weekend stay. Don't look at your listing yet. Click on the top 5 results. Scroll through all their photos. Read their full descriptions. Note their amenities lists. Check their review scores and recent reviews.
Step 2. Now Look at Your Listing (15 minutes) View your own listing as a guest would see it. Be brutally honest and ask does it excite you? Does it stand out from the 5 you just viewed? Would YOU book your property over theirs?
Step 3. Create a Comparison Matrix (30 minutes)
Most hosts who complete this exercise are shocked. What felt "fine" in isolation looks mediocre when honestly compared to top performers.
The Investment to Close the Gap
The good news is that closing these gaps doesn't require rebuilding your property. Strategic investments in the right areas create disproportionate returns.
Priority Investment Hierarchy
- Investment Area
- 1 Critical: Professional photography
- 2 High: Design refresh (paint, decor, staging)
- 3 High: Key amenities (work setup, coffee, beach gear)
- 4 Medium: Description rewrite plus listing optimization
- 5 Medium: Small detail upgrades (welcome, guidebook, supplies)
- 6 Ongoing: Guest experience refinement
- 1 Critical: $400 to $800
- 2 High: $3,000 to $8,000
- 3 High: $1,500 to $3,000
- 4 Medium: $0 to $500
- 5 Medium: $500 to $1,000
- 6 Ongoing: Time investment
- 1 Critical: 1 day shoot plus 1 week editing
- 2 High: 2 to 4 weeks
- 3 High: 1 to 2 weeks
- 4 Medium: 1 to 2 days
- 5 Medium: 1 week
- 6 Ongoing: Continuous
- 1 Critical: Plus 30% to 40% bookings
- 2 High: Plus 20% to 30% ADR
- 3 High: Plus 15% to 20% bookings
- 4 Medium: Plus 10% to 15% conversion
- 5 Medium: Plus 8% to 12% reviews
- 6 Ongoing: Plus 0.3 to 0.5 stars
- 1 Critical: 2 to 4 weeks
- 2 High: 2 to 3 months
- 3 High: 1 to 2 months
- 4 Medium: Immediate
- 5 Medium: 1 to 2 months
- 6 Ongoing: 2 to 3 months
Total Investment to Move from "Fine" to Top Tier Minimum effective investment is $5,500 to $10,000. Comprehensive upgrade runs $12,000 to $20,000. Premium transformation costs $25,000 to $40,000.
Expected Revenue Impact Current "fine" performance averages $4,500 per month. After strategic upgrades you'll see $6,750 to $8,500 per month. Revenue increase is $2,250 to $4,000 per month. Annual gain is $27,000 to $48,000. Payback period is 3 to 9 months.
Why "Fine" Kills Momentum
The insidious thing about "fine" is that it doesn't feel urgent to fix. Your property isn't falling apart. You're getting some bookings. Reviews are mostly positive. There's no crisis forcing action.
Meanwhile, your competitors are improving. New listings are launching with professional setups from day one. The market baseline keeps rising. Your "fine" becomes below average, then poor, then irrelevant, all while nothing about your actual property changed.
The Competitive Drift
- Your Property Status
- 2021: "Fine" (no changes)
- 2022: "Fine" (no changes)
- 2023: "Fine" (no changes)
- 2024: "Fine" (no changes)
- 2025: "Fine" (no changes)
- 2026: "Fine" (no changes)
- 2021: Basic expectations
- 2022: Rising standards
- 2023: Professional baseline
- 2024: High expectations
- 2025: Premium standard
- 2026: Exceptional required
- 2021: Above average
- 2022: Average
- 2023: Below average
- 2024: Poor
- 2025: Irrelevant
- 2026: Invisible
- 2021: 70% occupancy
- 2022: 62% occupancy
- 2023: 54% occupancy
- 2024: 48% occupancy
- 2025: 38% occupancy
- 2026: 25% to 30% occupancy
By the time declining bookings force action, you've lost 2 to 3 years of premium revenue and are starting from behind competitors who invested earlier.
The Professional Management Solution
At Stay Classy Homes, we specialize in transforming "fine" properties into top performers. Our process identifies exactly where your listing falls short and implements strategic improvements that generate the highest returns.
Our Competitive Analysis Includes
Professional Photography Assessment showing how your photos compare to top 10 competitors. Design Gap Analysis revealing which design elements are holding back your booking appeal. Amenity Benchmarking showing what guests expect in your neighborhood that you're missing. Listing Optimization Review comparing how your description, pricing, and positioning stack up. Review Performance Analysis explaining what's preventing you from reaching 4.8 stars and above. Custom Improvement Roadmap with prioritized investments and projected ROI for each.
What Our Properties Achieve
- Typical Self Managed "Fine" Property
- Review Score: 4.5 to 4.7 stars
- Photo Quality: DIY or amateur
- Design Appeal: Basic or functional
- Occupancy Rate: 45% to 55%
- Monthly Revenue: $4,200 to $5,500
- Review Score: 4.8 to 4.9 stars
- Photo Quality: Professional
- Design Appeal: Styled and curated
- Occupancy Rate: 68% to 78%
- Monthly Revenue: $7,200 to $9,500
- Review Score: Algorithm advantage
- Photo Quality: 40% more views
- Design Appeal: 25% higher ADR
- Occupancy Rate: Plus 23 points average
- Monthly Revenue: Plus 60% to 75%
Our interior design team knows exactly what San Diego guests respond to. Our photographers create images that stop scrollers mid browse. Our listing optimization gets you to the top of search results. Our operational excellence keeps you at 4.9 stars.
The management fee of 20% to 30% of revenue is more than offset by revenue increases from professional positioning, design, and operation. Properties under our management typically net 30% to 50% more after fees than they did self managed.
Take Action Before It's Too Late
Every month you wait to address these gaps costs you thousands in lost bookings. Q1 2026 bookings are happening right now. Summer 2026 reservations are already starting. Properties that make improvements in January capture these bookings. Those that wait until spring have already lost peak season.
Your Action Plan
This Week Complete the competitive analysis exercise by comparing your listing to top 5 in search. List the specific gaps in photos, design, amenities, description, and reviews. Prioritize investments based on ROI potential. Schedule professional photography immediately because it books up fast.
Next 30 Days Get new professional photos taken. Update listings with new images. Rewrite description using compelling storytelling. Add 2 to 3 key missing amenities. Implement small detail improvements.
60 to 90 Days Complete design refresh if needed. Monitor booking improvement. Focus on driving reviews from 4.6 to 4.8 stars and above. Continue refinement based on results.
Or Get Professional Help
Call us at 619-738-6199 for a free competitive analysis. We'll compare your listing to top performers in your neighborhood, identify exactly where you're losing bookings, and show you the specific investments that will generate the highest returns.
Most properties we analyze have 5 to 8 fixable gaps preventing them from competing with top performers. The investment to close these gaps typically pays for itself in 2 to 4 months through improved occupancy and rates.
Don't let another month pass watching competitors book while your calendar stays empty. "Fine" doesn't win bookings anymore. Professional positioning, design, and operation do.
The question isn't whether your property is good enough. The question is whether it's competitive when guests compare it to the other options they're seriously considering. If you're honest with yourself, you already know the answer.
Fix the gaps now, or continue wondering why you're making less while neighbors stay fully booked. The choice, and the revenue difference, is yours.


