
Why Most San Diego Airbnb Owners Are Making Less Money in 2025 (And What 2026 Holds)
By Jeremy Ashburn

San Diego vacation rental owners are closing out 2025 with a harsh reality: revenue is down across the board, and many operators who were profitable in 2024 are now struggling to break even. As we head into 2026, the challenges aren't going away—they're intensifying. If you've noticed your bookings slowing down, your nightly rates getting undercut, or your occupancy rates dropping throughout 2025, you need to understand what's happening and prepare for an even more competitive 2026. The market dynamics that crushed profits this year will only get worse without strategic changes to how you operate your vacation rental.
Struggling with declining revenue heading into 2026? Contact us to get a professional property assessment and 2026 revenue recovery plan, or call 619-738-6199.
The 2025 Revenue Collapse in Hard Numbers
The data from 2025 tells a stark story about what happened to San Diego Airbnb revenue this year, and it's setting up challenging conditions for 2026:
- 2023
- Average Occupancy Rate: 62%
- Average Daily Rate: $285
- Average Monthly Revenue: $5,481
- Median Annual Revenue: $65,772
- Average Occupancy Rate: 58%
- Average Daily Rate: $268
- Average Monthly Revenue: $4,938
- Median Annual Revenue: $59,256
- Average Occupancy Rate: 55%
- Average Daily Rate: $255
- Average Monthly Revenue: $4,576
- Median Annual Revenue: $54,912
- Average Occupancy Rate: -7 percentage points
- Average Daily Rate: -11% decline
- Average Monthly Revenue: -17% decline
- Median Annual Revenue: -$10,860 loss
Most hosts have seen their revenue drop 15-20% over the past two years. Properties that generated $70,000 annually in 2023 brought in just $56,000-59,500 in 2025. That's a $10,500-13,500 annual decline—over $1,000 less per month than just two years ago.

The bottom quartile has been hit even harder:
- 2023 Monthly Revenue
- Top 10%: $14,200
- Top 25%: $8,840
- Median: $5,481
- Bottom 25%: $3,120
- Top 10%: $13,000
- Top 25%: $7,966
- Median: $4,576
- Bottom 25%: $2,396
- Top 10%: -8%
- Top 25%: -10%
- Median: -17%
- Bottom 25%: -23%
Notice that top performers maintained relatively strong performance with only 8-10% declines, while median and lower-tier properties were devastated with 17-23% revenue drops. This trend is accelerating as we enter 2026.
The Oversaturation That Defined 2025
San Diego's vacation rental market reached critical mass in 2025. While the STRO ordinance caps were designed to control supply, thousands of licenses were issued before those caps were reached. Here's where the market stood by late 2025:
- Licenses Issued
- Tier 1 (Part-Time): 142
- Tier 2 (Home Sharing): 2,386
- Tier 3 (Whole Home): 4,655
- Tier 4 (Mission Beach): 1,097
- Total Active STRs: 8,280
- Tier 1 (Part-Time): Unlimited availability
- Tier 2 (Home Sharing): Unlimited availability
- Tier 3 (Whole Home): 896 remaining
- Tier 4 (Mission Beach): 0 available (waitlist closed)
- Total Active STRs: Near capacity
- Tier 1 (Part-Time): Minimal competition impact
- Tier 2 (Home Sharing): Significant room rental competition
- Tier 3 (Whole Home): Heavy whole-home competition
- Tier 4 (Mission Beach): Maximum saturation reached
- Total Active STRs: Severe oversupply
Nearly 6,000 whole-home vacation rentals competed for guests throughout 2025. This oversupply drove the price wars and occupancy drops that crushed host earnings. As we enter 2026, these same properties will continue fighting for bookings, with no relief in sight from the supply side.

The few remaining Tier 3 licenses (896 as of November 2025) will likely be claimed within the first quarter of 2026, permanently capping the market. But the damage from oversaturation is already done—the competition level heading into 2026 will be just as intense as what hosts faced in 2025.
Why 2025 Seasonal Patterns Signal Trouble for 2026
San Diego's traditional seasonal patterns shifted dramatically in 2025, and these changes are projected to continue into 2026:
- 2023 Performance
- Peak Summer (Jun-Aug): 68% occupancy, $450 ADR, $9,520/mo
- Shoulder (Mar-May, Sep-Oct): 61% occupancy, $340 ADR, $6,527/mo
- Low Season (Jan-Feb, Nov-Dec): 54% occupancy, $360 ADR, $6,156/mo
- Peak Summer (Jun-Aug): 61.7% occupancy, $422 ADR, $8,671/mo
- Shoulder (Mar-May, Sep-Oct): 56% occupancy, $310 ADR, $5,785/mo
- Low Season (Jan-Feb, Nov-Dec): 48.6% occupancy, $331 ADR, $4,695/mo
- Peak Summer (Jun-Aug): -9% revenue
- Shoulder (Mar-May, Sep-Oct): -11% revenue
- Low Season (Jan-Feb, Nov-Dec): -24% revenue
- Peak Summer (Jun-Aug): Further compression expected
- Shoulder (Mar-May, Sep-Oct): Continued softness likely
- Low Season (Jan-Feb, Nov-Dec): Starting 2026 weak
We're entering 2026 with the worst low-season performance in recent history. January and February 2026 are projected to be particularly challenging based on forward bookings data. Hosts who relied on relatively stable winter income to cover mortgages throughout 2025 will face the same struggles in early 2026.

The concerning trend is that peak summer performance also declined in 2025. If summer 2026 follows the same trajectory, even the high season won't provide the revenue cushion it once did.
The Expense Crisis That Crushed 2025 Profits Will Continue
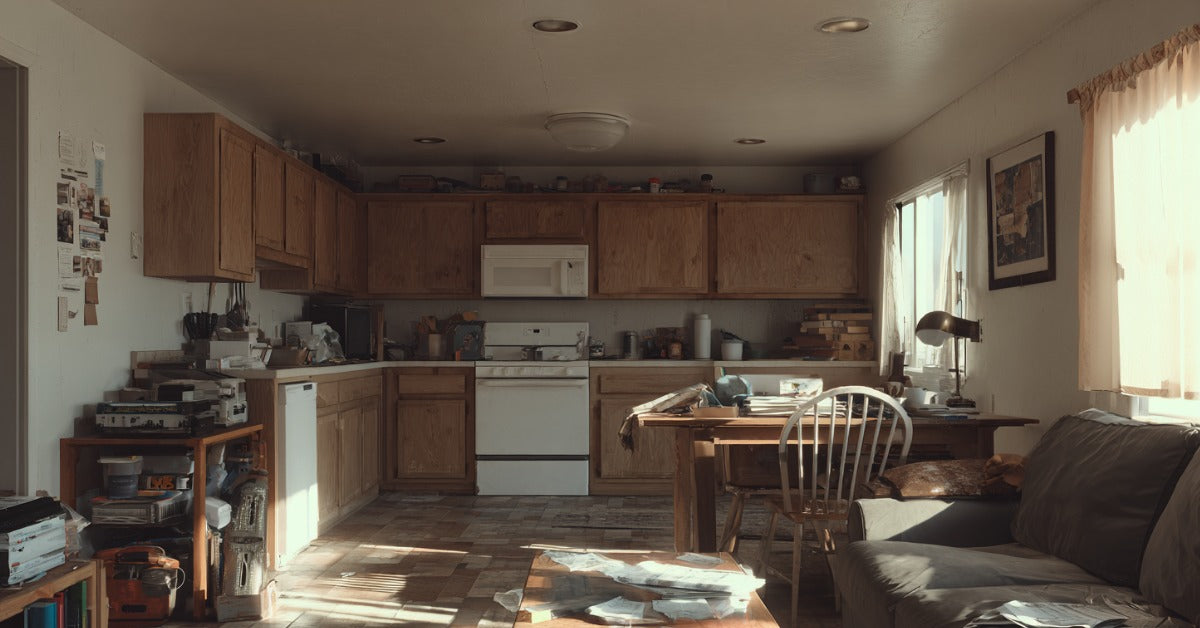
Even hosts who maintained decent occupancy in 2025 saw profits evaporate because expenses skyrocketed. These costs will remain elevated or increase further in 2026:
- 2023 Average
- Monthly Utilities: $250
- Per-Cleaning Cost: $120
- Monthly Insurance: $175
- Maintenance/Repairs (annual): $2,400
- Property Tax (annual): $4,800
- Platform Fees (% of revenue): 3-5%
- Monthly Utilities: $325
- Per-Cleaning Cost: $165
- Monthly Insurance: $285
- Maintenance/Repairs (annual): $3,360
- Property Tax (annual): $5,376
- Platform Fees (% of revenue): 3-5%
- Monthly Utilities: $340-360
- Per-Cleaning Cost: $175-190
- Monthly Insurance: $300-325
- Maintenance/Repairs (annual): $3,600-3,840
- Property Tax (annual): $5,700-6,000
- Platform Fees (% of revenue): 3-5%
- Monthly Utilities: +36-44%
- Per-Cleaning Cost: +46-58%
- Monthly Insurance: +71-86%
- Maintenance/Repairs (annual): +50-60%
- Property Tax (annual): +19-25%
- Platform Fees (% of revenue): Same % but of lower revenue
Let's look at the profit impact on a median-performing property heading into 2026:
- 2023
- Monthly Gross Revenue: $5,481
- TOT/TMD (12.5%): -$685
- Platform Fees (4%): -$219
- Cleaning (6 turnovers): -$720
- Utilities: -$250
- Maintenance Reserve (7%): -$384
- Insurance: -$175
- Supplies: -$150
- Net Operating Income: $2,898
- Monthly Gross Revenue: $4,576
- TOT/TMD (12.5%): -$572
- Platform Fees (4%): -$183
- Cleaning (6 turnovers): -$990
- Utilities: -$325
- Maintenance Reserve (7%): -$320
- Insurance: -$285
- Supplies: -$175
- Net Operating Income: $1,726
- Monthly Gross Revenue: $4,350-4,675
- TOT/TMD (12.5%): -$544-584
- Platform Fees (4%): -$174-187
- Cleaning (6 turnovers): -$1,050-1,140
- Utilities: -$340-360
- Maintenance Reserve (7%): -$305-327
- Insurance: -$300-325
- Supplies: -$185-200
- Net Operating Income: $1,452-1,552
- Monthly Gross Revenue: -15-21%
- TOT/TMD (12.5%): -15-21%
- Platform Fees (4%): -21-21%
- Cleaning (6 turnovers): +46-58%
- Utilities: +36-44%
- Maintenance Reserve (7%): -21-15%
- Insurance: +71-86%
- Supplies: +23-33%
- Net Operating Income: -46-50%
If you're barely breaking even now at the end of 2025, 2026 looks even bleaker without significant operational changes. Properties that generated $2,000-3,000 monthly profit in 2023 are projected to operate at losses or minimal profits in 2026.
Hotels Dominated in 2025 and Will Push Harder in 2026
The hotel industry fully recovered in 2025, and they're positioned to take even more market share in 2026. Here's the competitive landscape as we enter the new year:
- Average Nightly Cost
- Hotel (Downtown): $200/night
- Airbnb (Downtown): $180/night
- Hotel Advantage: —
- Hotel (Downtown): Parking, WiFi, breakfast, housekeeping, loyalty points
- Airbnb (Downtown): WiFi only
- Hotel Advantage: More services, rewards programs
- Hotel (Downtown): None
- Airbnb (Downtown): $150 cleaning + $75 service + $30 parking
- Hotel Advantage: —
- Hotel (Downtown): $600
- Airbnb (Downtown): $765
- Hotel Advantage: $165 savings
For business travelers and couples without kids, hotels became the obvious choice in 2025. This trend will accelerate in 2026 as hotels launch new loyalty programs and promotional campaigns targeting the January-February travel slump.
Major hotel chains are planning aggressive 2026 marketing campaigns specifically targeting travelers who switched to vacation rentals during the pandemic. Their message: predictable quality, no surprise fees, earn points for future stays.
Guest Expectations Rose in 2025 While Hosts Earned Less
Guests demanded more throughout 2025 while paying less, and these expectations are now firmly established heading into 2026. Here's what's now considered baseline versus what used to be premium:
- 2023 Status
- Fast WiFi (100+ Mbps): Premium
- Smart TVs with streaming: Nice to have
- Professional coffee maker: Premium
- Quality mattresses/bedding: Standard
- Work-from-home setup: Rare
- Welcome amenities: Premium touch
- 24/7 concierge service: Luxury
- Fast WiFi (100+ Mbps): Required baseline
- Smart TVs with streaming: Required baseline
- Professional coffee maker: Required baseline
- Quality mattresses/bedding: Premium expected
- Work-from-home setup: Increasingly expected
- Welcome amenities: Expected standard
- 24/7 concierge service: Expected
- Fast WiFi (100+ Mbps): Minimum 200+ Mbps
- Smart TVs with streaming: Multiple TVs expected
- Professional coffee maker: Specialty options expected
- Quality mattresses/bedding: Luxury hotel-grade
- Work-from-home setup: Multiple workspaces
- Welcome amenities: Personalized touches
- 24/7 concierge service: Instant response expected
- Fast WiFi (100+ Mbps): $100-150/month
- Smart TVs with streaming: $600-1,200 upfront
- Professional coffee maker: $300-600 upfront
- Quality mattresses/bedding: $1,000-2,000 per bed
- Work-from-home setup: $500-1,000
- Welcome amenities: $20-40 per booking
- 24/7 concierge service: Significant time commitment
Any property entering 2026 without these baseline amenities will struggle to compete. Guest tolerance for "good enough" properties disappeared in 2025 and won't return in 2026.
How Review Scores Determined 2025 Success (And Will Make or Break 2026)
Your review score determined your success or failure in 2025, and the threshold for "good enough" has risen even higher heading into 2026. Here's how review scores directly impacted bookings in 2025:
- Search Visibility
- 4.9-5.0 stars: Premium placement
- 4.8-4.89 stars: Good placement
- 4.7-4.79 stars: Average placement
- 4.5-4.69 stars: Below average
- Below 4.5 stars: Severely limited
- 4.9-5.0 stars: 18-22%
- 4.8-4.89 stars: 12-16%
- 4.7-4.79 stars: 8-12%
- 4.5-4.69 stars: 4-7%
- Below 4.5 stars: 2-4%
- 4.9-5.0 stars: 75-86%
- 4.8-4.89 stars: 65-75%
- 4.7-4.79 stars: 55-65%
- 4.5-4.69 stars: 40-50%
- Below 4.5 stars: 25-35%
- 4.9-5.0 stars: Baseline (best)
- 4.8-4.89 stars: -15% vs top tier
- 4.7-4.79 stars: -30% vs top tier
- 4.5-4.69 stars: -50% vs top tier
- Below 4.5 stars: -70% vs top tier
If you ended 2025 below 4.8 stars, you're starting 2026 at a severe disadvantage. Platform algorithms are reportedly making review scores even more important in their 2026 ranking updates.
The 2026 reality: Properties below 4.7 stars will be essentially invisible in search results. If you're not already at 4.8+, getting there needs to be your primary focus for Q1 2026.
Platform Algorithm Changes Throughout 2025 Predict 2026 Challenges
Airbnb and Vrbo made significant algorithm changes throughout 2025 that will continue impacting hosts in 2026:
- Impact on Search Visibility
- Instant Book Enabled: High
- Response Time <10 minutes: Very High
- Review Score 4.8+: Critical
- Cancellation Rate <1%: High
- Calendar Availability >90%: Medium
- Competitive Pricing (bottom 40%): High
- Instant Book Enabled: 40% more visibility
- Response Time <10 minutes: 60% more inquiries
- Review Score 4.8+: 3x more bookings
- Cancellation Rate <1%: 35% boost
- Calendar Availability >90%: 20% improvement
- Competitive Pricing (bottom 40%): 50% more views
- Instant Book Enabled: Increasing
- Response Time <10 minutes: Critical
- Review Score 4.8+: Mandatory threshold
- Cancellation Rate <1%: Strictly enforced
- Calendar Availability >90%: Increasing weight
- Competitive Pricing (bottom 40%): More important
Platform representatives have indicated that 2026 will see even more algorithm refinement, with greater emphasis on "host reliability" metrics. Properties that weren't optimized for these factors in 2025 will fall even further behind in 2026 search results.
What Separated Winners from Losers in 2025
The hosts who maintained or grew revenue in 2025 did specific things that will be even more critical in 2026:
- Struggling Properties (2025)
- Photography: DIY iPhone photos (2+ years old)
- Interior Design: Original furnishings, no updates
- Response Time: 2-6 hours average
- Pricing Strategy: Manual, rarely adjusted
- Instant Book: Disabled
- Calendar Management: Blocks out personal dates
- Guest Experience: Basic checklist approach
- Review Management: Responds occasionally
- Photography: Professional shots (<12 months)
- Interior Design: Refreshed design every 2-3 years
- Response Time: <10 minutes (often automated)
- Pricing Strategy: Dynamic software-based
- Instant Book: Enabled
- Calendar Management: Always available
- Guest Experience: Thoughtful touches, local guide
- Review Management: Responds to every review within 24hrs
- Photography: +35% bookings
- Interior Design: +25% ADR
- Response Time: +60% inquiries
- Pricing Strategy: +15-20% revenue
- Instant Book: +40% visibility
- Calendar Management: +20% bookings
- Guest Experience: +0.3-0.5 star rating
- Review Management: Better algorithm ranking
- Photography: Mandatory
- Interior Design: Critical differentiator
- Response Time: Algorithm requirement
- Pricing Strategy: Essential for competitiveness
- Instant Book: Near-mandatory
- Calendar Management: Algorithm penalty for blocking
- Guest Experience: Survival requirement
- Review Management: Expected standard
Properties that didn't make these changes in 2025 fell behind. Those that don't implement them in early 2026 will be priced out of competitiveness entirely.
What You Must Do in Q1 2026 to Survive
If your San Diego vacation rental underperformed in 2025, you have a narrow window in Q1 2026 to turn things around before peak summer season. Here's what recovery requires:
- Investment Required
- Professional Photography: $400-800 one-time
- Design Refresh (moderate): $5,000-15,000
- Dynamic Pricing Software: $25-50/month
- Professional Management: 20-30% of revenue ongoing
- Operations Overhaul: Time investment or mgmt fee
- Platform Optimization: Minimal cost, time investment
- Professional Photography: January completion
- Design Refresh (moderate): Jan-Feb implementation
- Dynamic Pricing Software: January setup
- Professional Management: January transition
- Operations Overhaul: Jan-Mar
- Platform Optimization: January completion
- Professional Photography: +30-40% bookings
- Design Refresh (moderate): +20-25% ADR
- Dynamic Pricing Software: +15-20% revenue
- Professional Management: +25-35% gross revenue
- Operations Overhaul: +0.3-0.5 star rating
- Platform Optimization: +20-30% visibility
- Professional Photography: CRITICAL - Do first
- Design Refresh (moderate): HIGH - Before summer
- Dynamic Pricing Software: CRITICAL - Immediate
- Professional Management: HIGH - If self-managing failed
- Operations Overhaul: CRITICAL - Must reach 4.8+
- Platform Optimization: CRITICAL - Algorithm changes
January 2026 is your window. Properties that make these changes by February will be positioned for summer success. Those that wait until May or June will have already lost the critical summer booking window.
The Reality Check for 2026
San Diego's vacation rental market will be even more competitive in 2026 than it was in 2025. The supply constraints that defined 2025 will continue. Guest expectations that rose throughout 2025 are now permanent. The expenses that crushed margins in 2025 aren't coming down.
Here's what it takes to succeed in 2026 versus what worked in previous years:
- 2020-2022 (Boom Era)
- Competition Level: Low - Limited listings
- Guest Expectations: Moderate - Happy with basics
- Success Requirements: Basic listing, decent photos
- Price Sensitivity: Low - Guests paid premiums
- Time Investment: Part-time management worked
- Profit Margins: 60-75% net margins
- Algorithm Complexity: Simple - Just list and book
- Competition Level: High - Market saturated
- Guest Expectations: High - Demanding resort quality
- Success Requirements: Professional operation required
- Price Sensitivity: High - Comparison shopping
- Time Investment: Full-time or professional mgmt
- Profit Margins: 40-55% for well-managed
- Algorithm Complexity: Complex - Constant optimization
- Competition Level: Intense - Cap reached
- Guest Expectations: Premium - Hotel-level service expected
- Success Requirements: Complete optimization mandatory
- Price Sensitivity: Extreme - Every dollar matters
- Time Investment: Professional management near-essential
- Profit Margins: 35-50% even with optimization
- Algorithm Complexity: Critical - Perfect execution required
Amateur operators who survived 2025 will be forced out in 2026. Only professional operations that treat vacation rentals as a serious business will maintain profitable operations.
Your 2026 Action Plan
If you want to turn around declining revenue as we enter 2026, here's your immediate action plan:
Week 1 (Early January):
- Get professional photography scheduled (book now before peak season rush)
- Enable instant book on all platforms
- Implement dynamic pricing software
- Audit your current review score and identify improvement areas
Week 2-3 (Mid-January):
- Update all listing photos with professional shots
- Refresh listing descriptions to highlight 2026 amenities
- Review and lower cleaning fees to improve total price competitiveness
- Set up automated response templates for common questions
Week 4-6 (Late January-Early February):
- Complete any design refreshes or amenity upgrades
- Optimize calendar availability (remove personal blocks)
- Audit competitor listings and adjust pricing strategy
- Implement guest experience improvements to drive 5-star reviews
February-March:
- Monitor performance metrics weekly
- Continue optimizing based on booking patterns
- Build up positive reviews before summer season
- Adjust strategy based on early 2026 results
At Stay Classy Homes, we're helping property owners implement complete 2026 recovery plans throughout January. Our approach includes:
- Interior design transformation that makes properties photograph beautifully and command premium rates for summer 2026
- Revenue management through dynamic pricing optimized for 2026 market conditions
- Operations excellence that delivers 5-star guest experiences consistently
- Complete compliance handling so you never worry about permits, taxes, or regulations
- Professional photography that makes your listing stand out in crowded 2026 search results
Properties that engage professional management in January typically see revenue improvements of 25-50% by summer season. Those that wait until spring have already missed critical booking windows.
Don't let 2026 be another year of declining revenue. The market has fundamentally changed, and properties that don't adapt will continue losing money. Call us at 619-738-6199 for a free property assessment and customized 2026 revenue recovery plan. We'll show you exactly what needs to change and how much revenue improvement you can realistically expect.
The difference between struggling through another disappointing year and actually thriving in 2026 comes down to the decisions you make in the next 30 days. Start the year right with a clear plan and professional execution.
If your San Diego vacation rental is underperforming and you're ready to turn it around, call us at 619-738-6199 for a free property assessment and revenue recovery plan. The market has changed, but opportunities still exist for operators willing to adapt and execute professionally.


